Key Findings
RELATIONSHIP BETWEEN EMPLOYEE OWNERSHIP (EO) AND FIRM VALUE
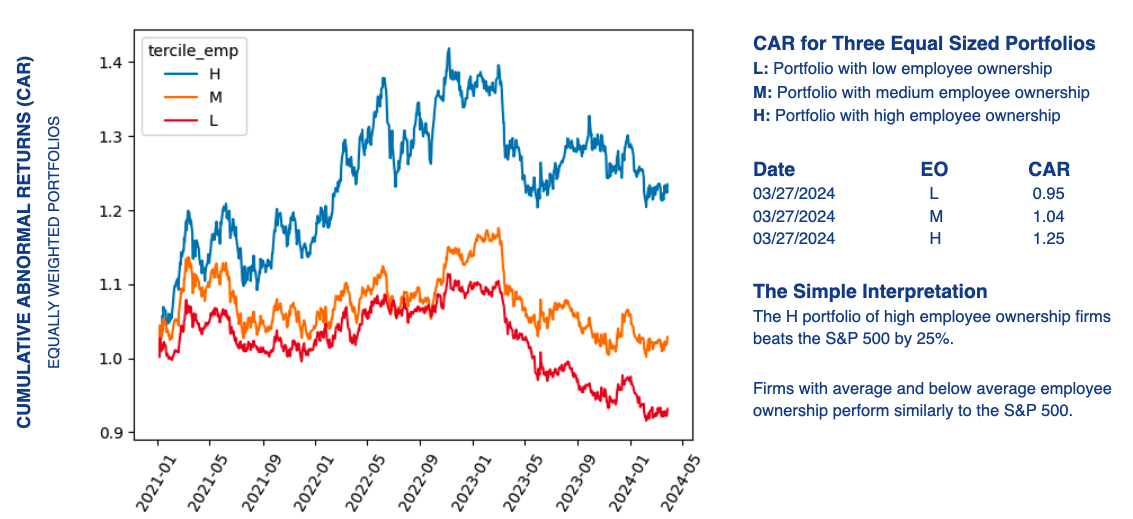
Our comprehensive analysis of EO data for the largest 1,500 U.S. public companies revealed that firms with high relative EO (H tercile illustrated below) outperformed the S&P 500 benchmark by 25%. As expected, the M tercile (average ownership) and L tercile (low ownership) marginally outperformed and underperformed the benchmark.
LLM–BASED MEASUREMENT OF BROAD–BASED EMPLOYEE OWNERSHIP
Following development, testing, and validation of the AI measurement tool, we applied an LLM–based pipeline to 691 U.S. public firms across 10 years to classify equity instruments across four tiers of compensation.
The resulting panel dataset enabled systematic comparison of equity compensation architectures at scale

Our language models and rules–based lookups enumerated every plan. Results included:
45% of S&P 500 firm–years feature some form of broad–based EO
11% offer equity grants to non–executive employees
60% of equity grant plans are configured as RSUs
Industry clustering is pronounced for ESPPs
Technology, retail and healthcare show higher adoption
16% of ESPPs offer only a 5% discount
27% of ESPPs include a look-back provision
RSU–only configurations account for 61% of true broad–based firm years
Options–only plans account for only 3% of equity grant plans
RELATIONSHIP BETWEEN BROAD–BASED EO AND FIRM VALUE
We conducted a 10–year cumulative abnormal returns (CAR) analysis of the S&P 500 firms in our sample

The results revealed the following:
Firms offering ESPP and grants broadly to their employees generated 2.4% higher abnormal returns than firms that did not.
The 2.4% figure changed marginally to 2.3% after controlling for variables
Panel fixed effects show no performance penalty for firms to broaden EO distribution
We are scaling our LLM–based pipeline across the largest 1,500 public firms, conducting a CAR analysis, and applying econometric modelling to control for all possible variables.